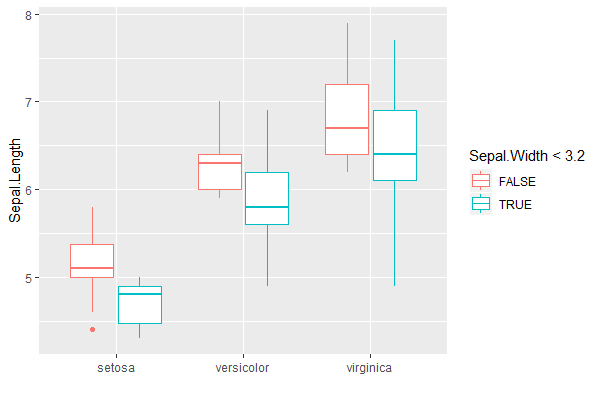
boxplot をグループごとに並べて表示したときに legend をx軸にもってきたい,とかいうことが起こった場合,描画された各要素の座標を取ってくればできるのではないか,とやってみた実験.
実用的には,パワポとかで編集した方がはやい.
gtable にして中身をしらべる. grob のid がプロットごとに変わるので,grep してがんばる. 文字の大きさとかはもう少しいい感じにできると思う.
Before
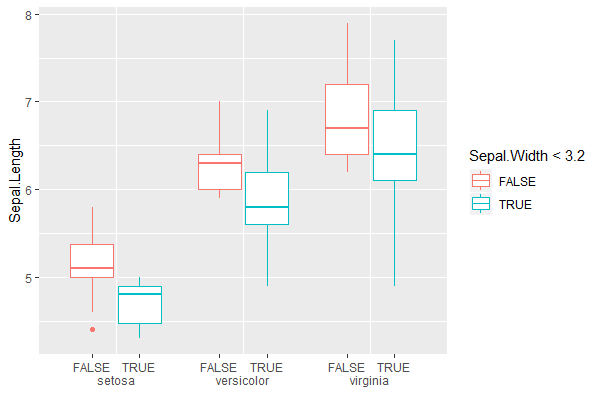
After
 library("ggplot2")
 library("dplyr")
 library("grid")
 library("stringr")
 library("purrr")

 # 元のグラフ
 gp <- ggplot(data = iris, aes(Species, Sepal.Length)) +
   geom_boxplot(aes(colour = Sepal.Width < 3.2)) +
   scale_x_discrete(name="")
 gp

 # 種名(後で使う)
 species_names <- c("setosa", "versicolor", "virginia")

 # ggplot の各レイヤーの情報を取得
 gt <- ggplotGrob(gp)

 # 各ボックスプロットの座標を取得
 # レイヤー名などは毎回変わる
 # 6番目のpanel 指定
 # gt$grobs[[6]]
 # そこから children をたどって geom_boxplot.gTree.xxx というのを探す
 # これの children が boxplot を描画している要素
 # 各boxplot の children から segment を探す
 ## segment はエラーバーを描画している
 ## ない場合は boxplot の頂点の座標から計算する
 # segment の x0 が求めたい座標

 filter_child <- function(node, pattern){
   node %>%
     pluck("children") %>%
     attributes() %>%
     pluck("names") %>%
     str_subset(pattern)
 }


 filter_grobs <- function(node, pattern){
   node %>%
     pluck("grobs") %>%
     map_chr(function(x){
       x$name
     }) %>%
     str_which(pattern)
 }

 id.panel <- grep("panel", gt$layout$name)

 geom_boxplot_name <- gt$grobs[[id.panel]] %>%
   filter_child("^geom_boxplot.gTree")

 x <- gt$grobs[[id.panel]] %>%
   pluck("children") %>%
   pluck(geom_boxplot_name) %>%
   pluck("children") %>%
   map_dbl(function(x){
     grid_segments_name <- x %>%
       filter_child("^GRID.segments")
     x %>%
       pluck("children") %>%
       pluck(grid_segments_name) %>%
       pluck("x0") %>%
       pluck(1)
   }) %>%
   unit("native")

 # 軸の情報を変更
 # ラベルのx座標
 id.axis <- grep("axis-b", gt$layout$name)
 id.axis_text_x_bottom <- filter_grobs(gt$grobs[[id.axis]]$children$axis, "^axis.text.x.bottom..titleGrob")
 grid_text_name <- gt$grobs[[id.axis]]$children$axis$grobs[[id.axis_text_x_bottom]] %>%
   filter_child("^GRID.text")

 x_org <- unit(gt$grobs[[id.axis]]$children$axis$grobs[[id.axis_text_x_bottom]]$children[[grid_text_name]]$x, "native")

 gt$grobs[[id.axis]]$children$axis$grobs[[id.axis_text_x_bottom]]$children[[grid_text_name]]$x <- unit.c(x, x_org)

 # ラベル名
 l <- c("FALSE", "FALSE", "FALSE", "TRUE", "TRUE", "TRUE")
 gt$grobs[[id.axis]]$children$axis$grobs[[id.axis_text_x_bottom]]$children[[grid_text_name]]$label <- c(l, species_names)

 # ラベルのy座標
 y <- rep(unit(1, "npc"), 6)
 gt$grobs[[id.axis]]$children$axis$grobs[[id.axis_text_x_bottom]]$children[[grid_text_name]]$y <- unit.c(y, unit(rep(0, 3), "npc"))


 # x軸目盛(tick)の変更
 # x座標
 id.axis_ticks_x_bottom <- filter_grobs(gt$grobs[[id.axis]]$children$axis, "^axis.ticks.x.bottom")
 gt$grobs[[id.axis]]$children$axis$grobs[[id.axis_ticks_x_bottom]]$x <- sort(rep(x, 2))

 # y座標
 gt$grobs[[id.axis]]$children$axis$grobs[[id.axis_ticks_x_bottom]]$y <- rep(gt$grobs[[id.axis]]$children$axis$grobs[[id.axis_ticks_x_bottom]]$y, 2)

 # id.length?
 gt$grobs[[id.axis]]$children$axis$grobs[[id.axis_ticks_x_bottom]]$id.lengths <- c(2, 2, 2, 2, 2, 2)

 plot(gt)